|
|
|
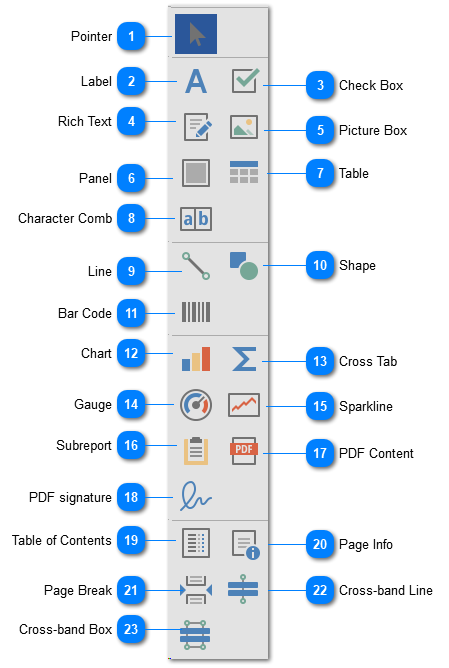
 PointerThe pointer is the default selected tool in the toolbox. It does nothing except acting as a cancel option for the other controls.
| |
 LabelThe label button makes it possible to add additional labels to the report.
It is possible to connect a label box with a field of the database, if the field was selected while exporting.
| |
 Check BoxThe check box button is used to display both text and a check box on the report.
| |
 Rich TextThe rich text box adds a field to add text.
The text in this box is somewhat limited by the size of the box, while text in labels can beyond the size if necessary.
| |
 Picture BoxThe picture box is used to display images on a report.
| |
 PanelThe panel control is used to group controls together.
If the panel is moved, all other controls within the panel are moved along with it.
| |
 TableThe table button is used to add tables to the report.
| |
 Character CombThe Character Comb control displays text so that each character is printed in an individual cell.
| |
 LineThe line button adds a line to the report.
The length and orientation (horizontal, vertical and diagonal) are customizable.
| |
 ShapeThe shape button adds a shape to the report.
Shapes range from simple shapes like rectangles to stars, arrows and other more complex shapes.
| |
 Bar CodeThe barcode button adds a barcode to the report.
This barcode is automatic generated, depending on the related data.
| |
 ChartThe chart button adds a chart to the report.
There are eight different type of charts available:
| |
 Cross TabTo show the relationship between two or more variables.
| |
 GaugeThe gauge button adds a gauge to the report.
| |
 SparklineThe sparkline button adds a sparkline to the report.
Data from the database can be used to be represented in the sparkline.
| |
 SubreportThe subreport button adds a subreport to the report.
The subreport is an existing report, saved earlier, that is added to the current report. This can be useful if a smaller report is an essential part of another report.
| |
 PDF ContentDisplay a given PDF in the report.
| |
 PDF signatureAdd PDF signature section
| |
 Table of ContentsThe table of contents adds a table of contents to the report.
It is advisable to set this somewhere in the ReportHeader, otherwise this will be repeated every page.
| |
 Page InfoThe page info button adds page info to the report.
Page info can range from page number, username or even the current time and date.
| |
 Page BreakThe page break button adds a page break to the report.
Page break marks a point in the report when the next page should start. Can be useful to separate data.
| |
 Cross-band LineThe cross-band line button adds a line which crosses over bands.
The cross-band line allows the user to draw a line through one or more bands. This line can be useful to visually emphasize data consisting of multiple bands.
| |
 Cross-band BoxThe cross-band box button adds a box which crosses over bands.
Similar to the cross-band line, the cross-band box allows the user to draw a box through one or more bands.
| |
|
|
|
|