

Results automated curation explained
Results of the automated curation tool are stored in separate HTML files.
The location of those files are provided in the Path to store results (#13 of One field curation)
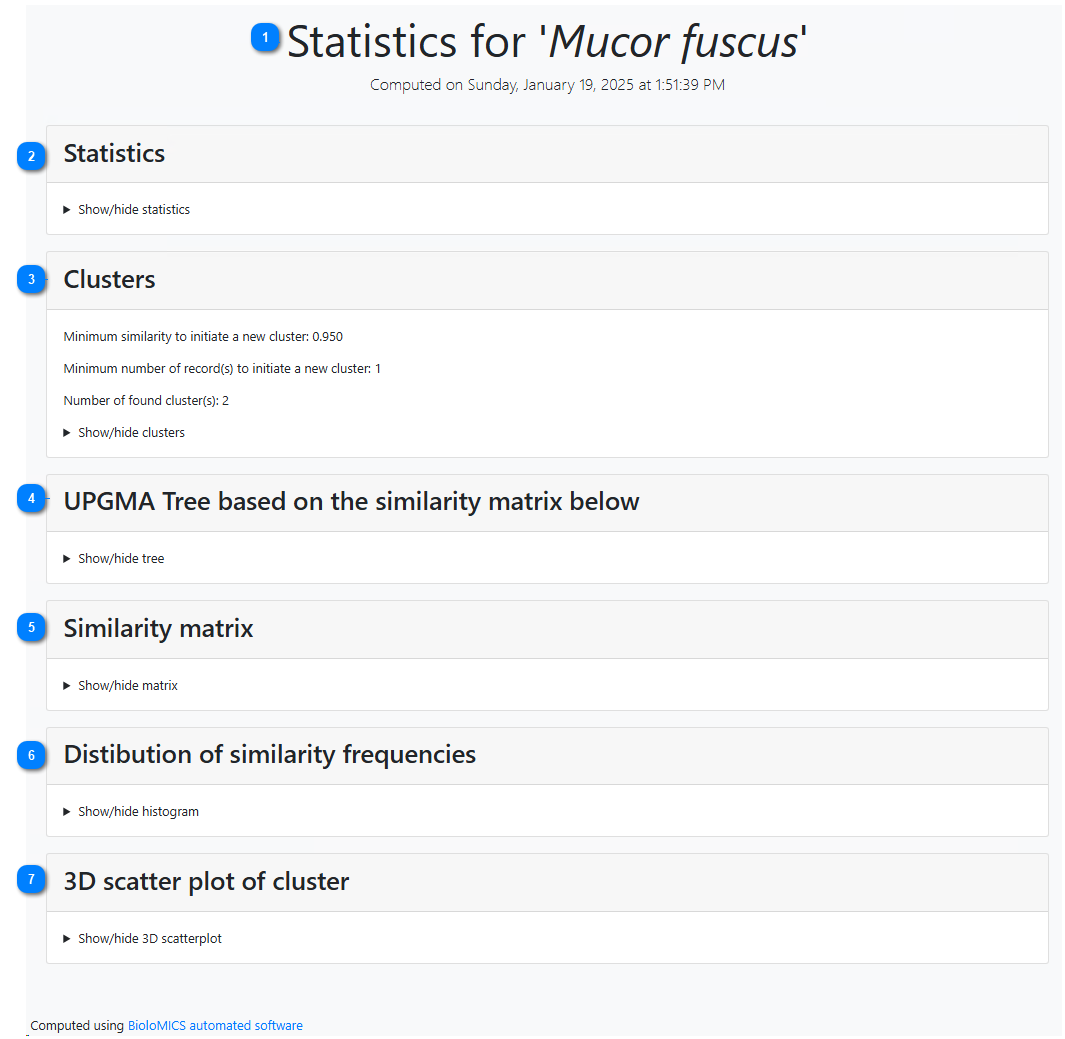
 The title is showing the specific item the records were grouped by (#1 of One field curation and #1 of Multiple field curation).
In this case we group by taxon name.
|
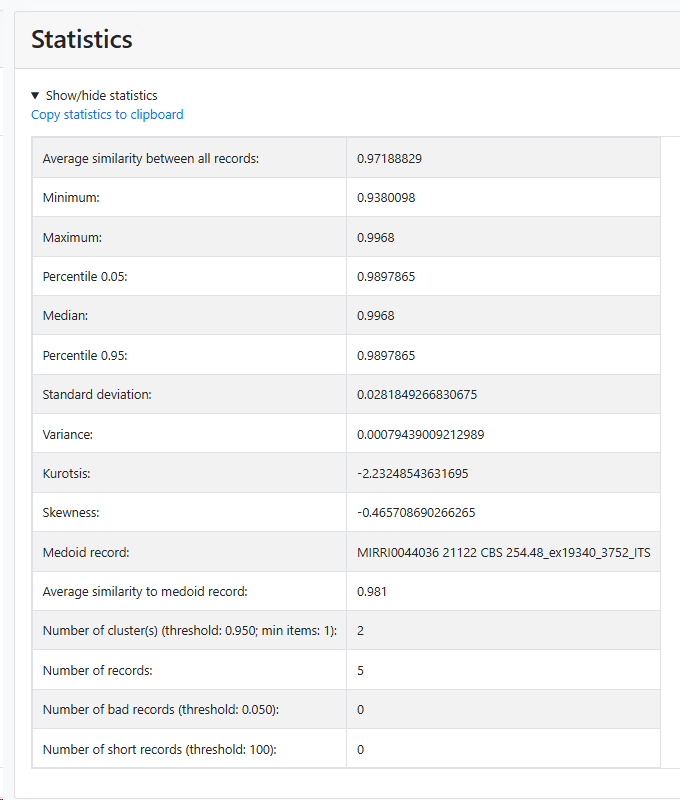
This section will be present when it has been check in the wizard (#8 of One field curation and #8 of Multiple field curation).
Same results as provided in the wizard grid (step 7 of One field curation and step 7 of Multiple field curation)
Statistics can be copied to clipboard using the provided link.
 |
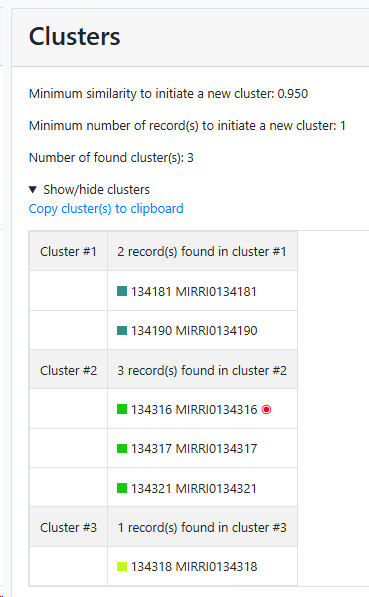
This section will be present when it has been check in the wizard (#8 of One field curation and #8 of Multiple field curation).
Shows which strains are in which cluster.
Cluster details can be copied to clipboard using the provided link.
 |
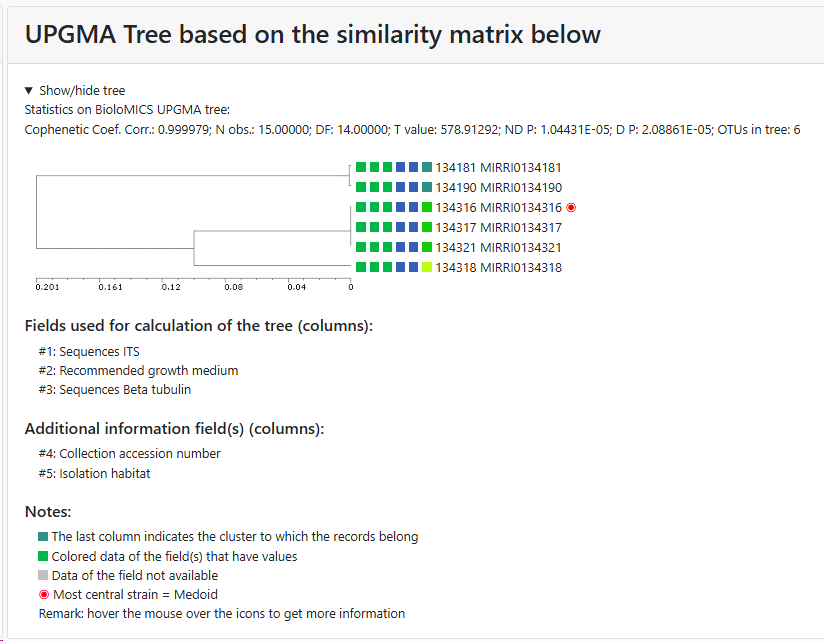
This section will be present when it has been check in the wizard (#3 of One field curation and #3 of Multiple field curation).
 |
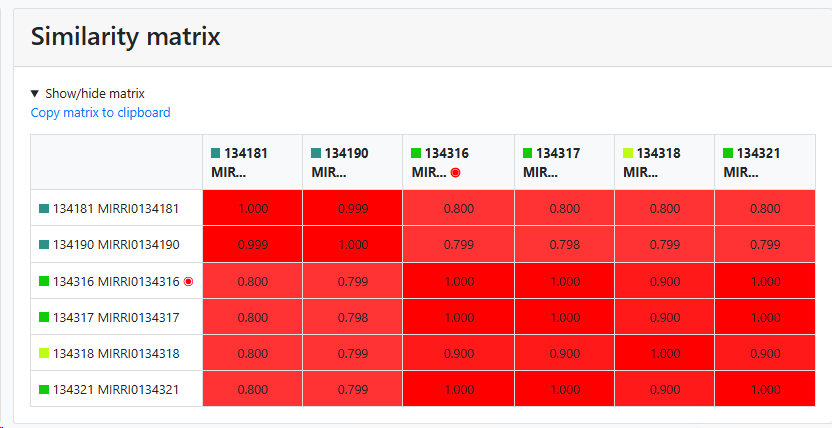
This section will be present when it has been check in the wizard (#7 of One field curation and #7 of Multiple field curation).
Shows the similarity matrix between the items in the comparison (sequences in this case)
 |
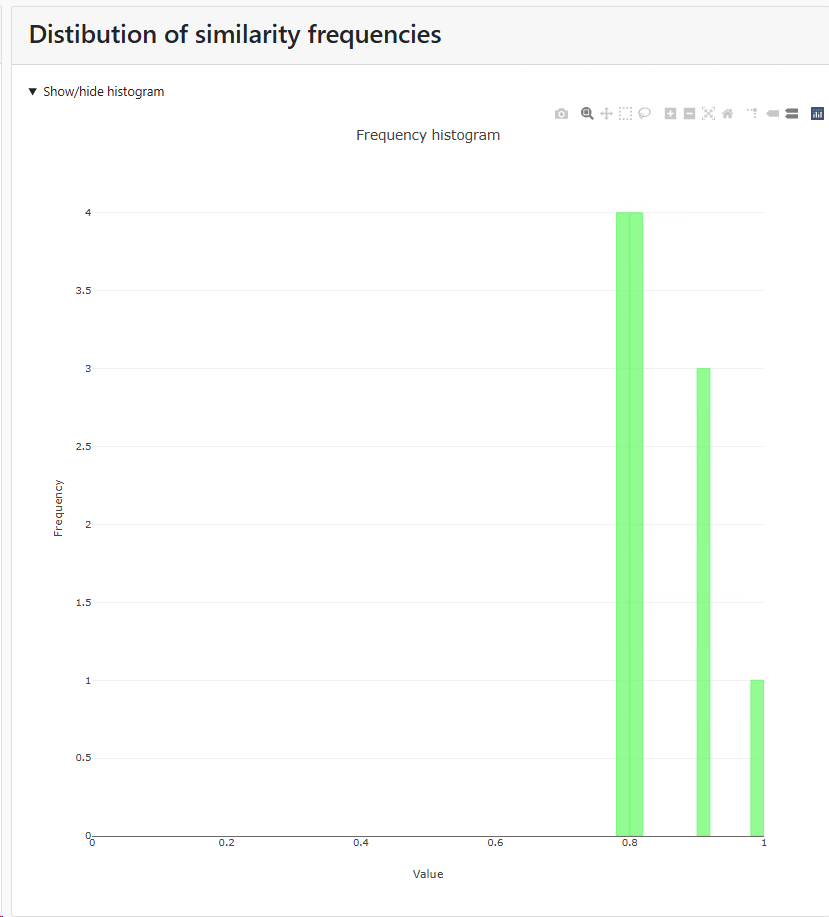
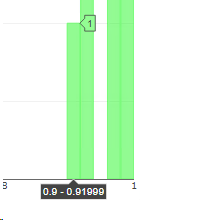
This section will be present when it has been check in the wizard (#12 of One field curation and #12 of Multiple field curation).
Shows the percentage of similarity on the x-axis and the number of items on the y-axis.
|
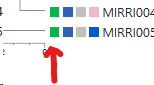
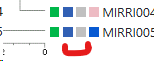
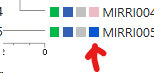
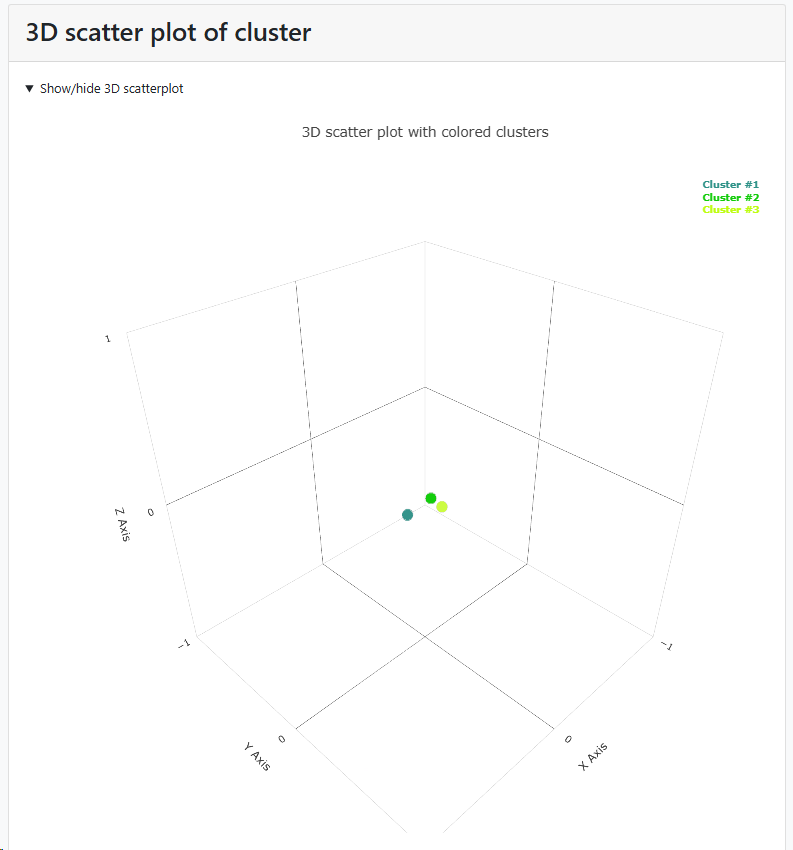
This section will be present when it has been check in the wizard (#6 of One field curation and #6 of Multiple field curation).
Shows the different clusters, each having its own color.
The plot can be turned by using the mouse.
Hover the mouse on a dot to see more details.
 |