*Make sure there is an F-link field in the target table that groups the records (in this case in the Taxonomy table). This field will be used to store the statistics. This is only needed when multiple fields are used for this analyzes.
Select one or several criteria to compare all records in a given cluster and mark the ones that are outliers.
So, it is to look at the strain and see if it is really in the right cluster, and to see if all data are present etc. In this way it is easy to see what data are missing.
-
Do a search for the wanted records in the main grid of BioloMICS.
The tool will take all records currently in the grid (all pages takes).
So if a part of the data should be used, then first do a query to get the wanted records.
-
For example, search for all records that have an ITS sequence AND a Beta tubulin sequence linked AND has a value in the field Growth media.

-
Go to Other Tools and click on Automated curation.
-
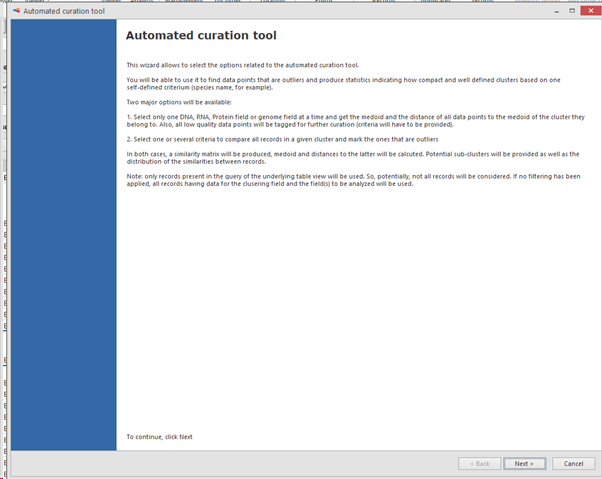
Popup window appears with a short explanation.
-
The 'one field' will be explained in this chapter and is to point out the outsiders at the unit level (sequence level in this case).
-
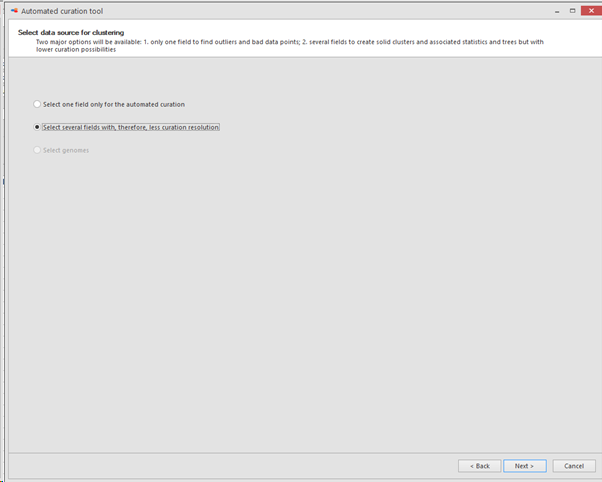
3. Select second option: ‘
Select several fields with, less curation resolution’.
It will use all selected fields to create solid clusters and associated statistics and trees but with lower curation possibilities.

-
-
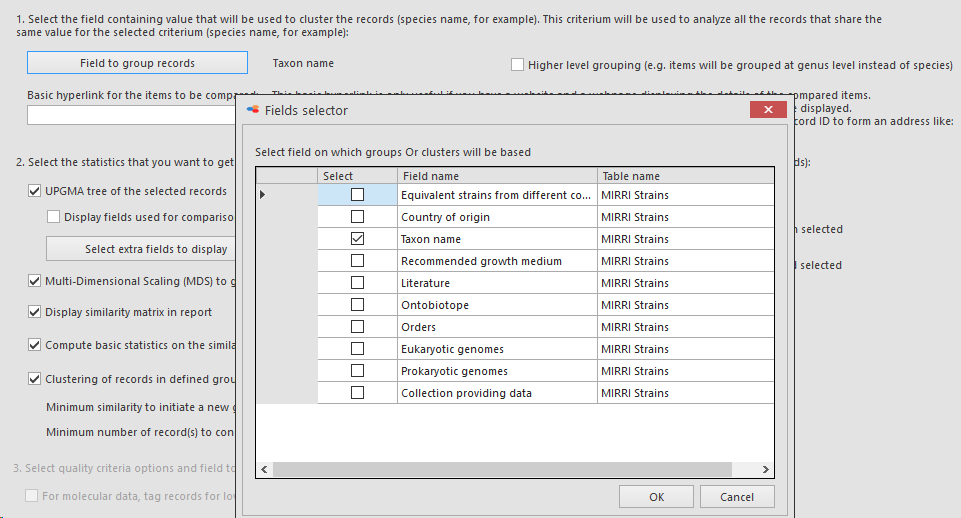
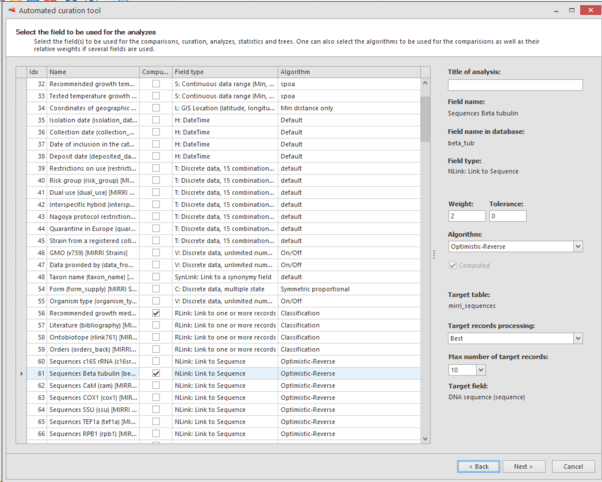
In the next step select the fields to be used for the comparisons, curation, analyzes, statistics and trees.
-
On the right, the algorithm can be selected that will be used for the comparisons and well as some other options like weigth.
Here we will select:
-
the sequence link-field for ITS sequences - weight 2
-
the sequences link-field Beta tubulin sequences - weight 2
-
Growth media - weight 1
-
-
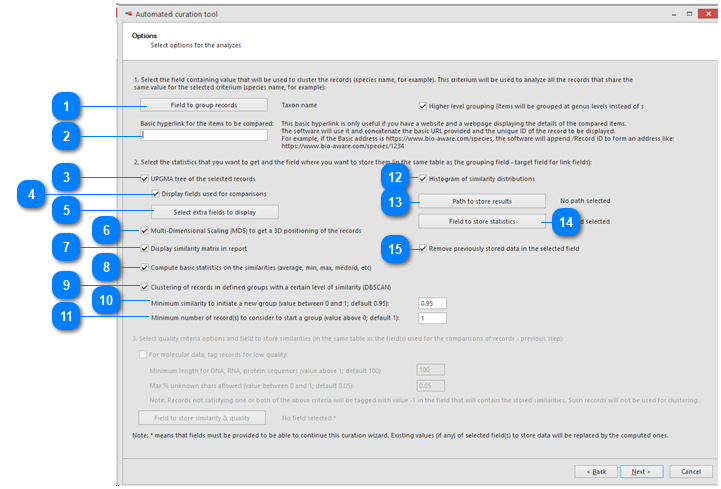
Then select the options for the analyzes:
Hover the mouse on top of the number to see the details.
-
-
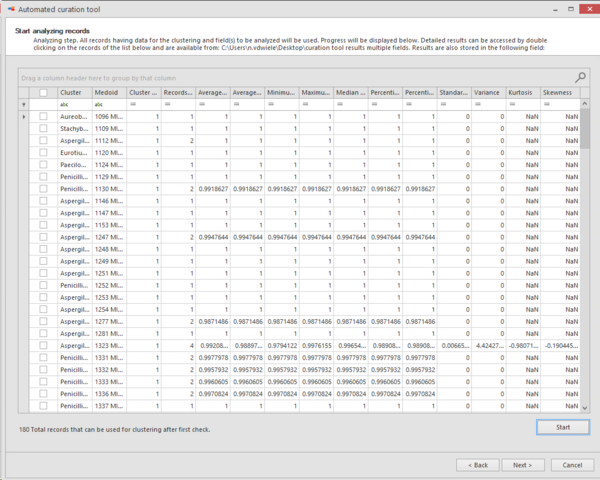
Analyzing step. All records having data for the clustering and fields to be analyzed will be used.
Progress will be displayed at the bottom of the popup window.
Detailed results can be accessed by double clicking on the records of the provided list and are available from the provided path place (#13).
-
Now it will do the following:
-
Loading selected records.
-
Checking for each sequence if the length is long enough to be part of the analysis, otherwise it will be rejected and it gets a score of -2.
-
Analyzing cluster
per species name (in this case).
-
All found
species names (in this case) are listed together with extra information in separate columns:
-
Cluster:
Species name (in this case).
-
Medoid: Name of the strain that is indicating the medoid of the given species.
-
Medoid = the one with the smallest distance to all other point in the same species (in this case).
-
Cluster number: Number of cluster(s) found. Note that the bad and short
sequences are excluded.
-
Record number: Number of records found.
-
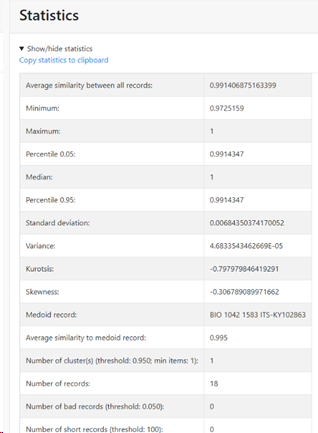
Average similarity to Medoid: Average similarity to medoid record.
-
Average similarity: Average similarity between all records.
-
Minimum similarity: The furthest pair of points within the
species.
-
Maximum similarity: The closest pair of points within the
species.
-
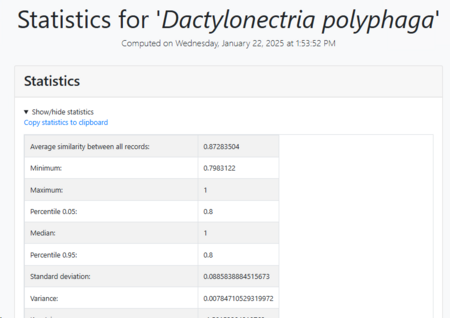
Double click on a given
species name to open the HTML document and to see all the details. Note that when there is only 1 record in the group then the report is not generated.
-
-
Click next to continue and to complete the analyzes.
-
Completion of the analyzes.
-
The statistics are stored in the file link-field that was selected in #14.
This movie shows how to use the Automated curation tool using multiple fields.
1. Search for wanted records (0:26)
2. Start Automated curation (0:59)
3. Select multiple fields (1:08)
4. Select fields to be used for the analyzes (1:15)
5. Set options (1:37)
6. Start analyzing records (2:16)
7. Read results (2:51)
8. Complete wizard (3:57)
9. Check statistics (4:03)
All needed information is given above this line.
_________________________________________________________________________________________
|
Field to group records: Select the field containing the value that will be used to cluster the records (species name for example).
This criterium will be used to analyze all the records that share the same value for the selected criterium (species name for example).
-
Here we will select Taxon name. So this means that the data in the 3 selected fields (selected in previous step) will be grouped based on the taxon name value (species name) in the MIRRI taxonomy link-field. So all Candida albicans’ together and all Cryptococcus neoformans’ together etc. 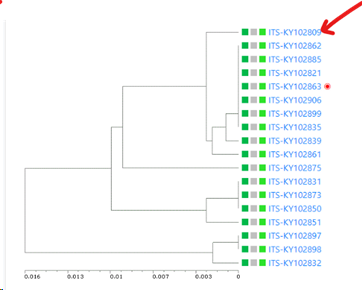
-
Higher level grouping (items will be grouped at genus level instead of species): If checked then the items will be grouped based on the level above, so if the record name contains the species name then in this case the genus will be used for the grouping.
-
For Synlink fields: it takes the value before the first space that is the higher level. And groups based on that first text. -
For Olink fields: the parent is taken.
|
|
|
Basic hyperlink for the items to be compared: This hyperlink is useful when there is a website displaying the details of the compared items.
The link will be presented in the clustering tree in the results.
The software will use the provided basic hyperlink and concatenate it with the unique ID of the record to be displayed.
For example, if the basic address is https://www.bio-aware.com/species, the software will append /Record ID to form and address like: https://www.bio-aware.com/species/1234.
If no basic hyperlink is provided then there won’t be a hyperlink in the clustering tree in the results.
|
|
|
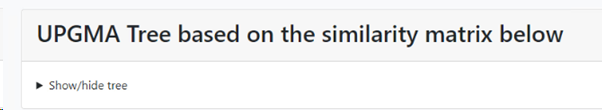
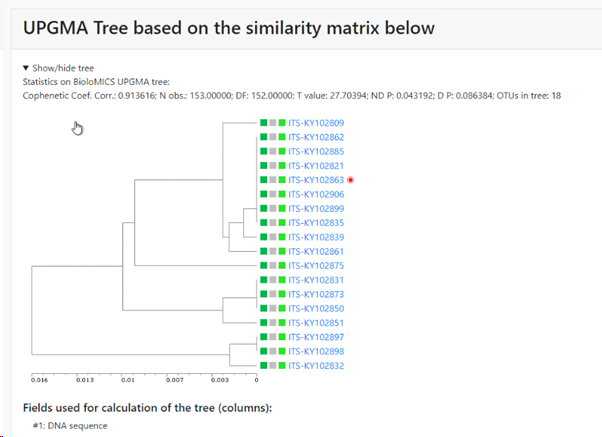
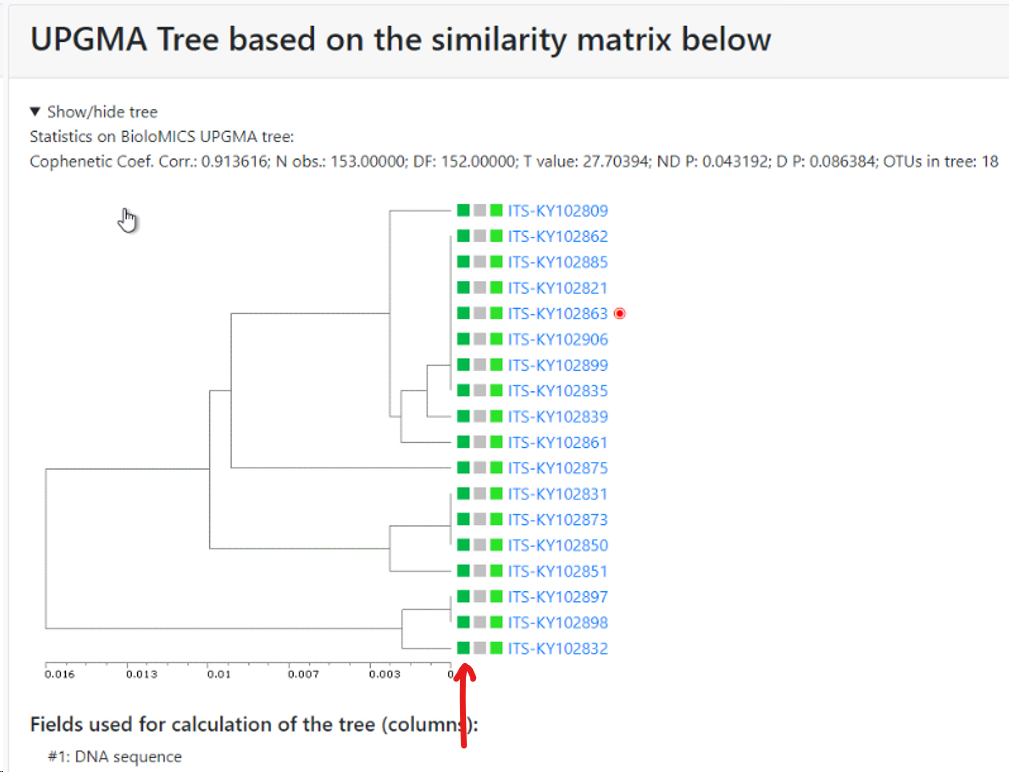
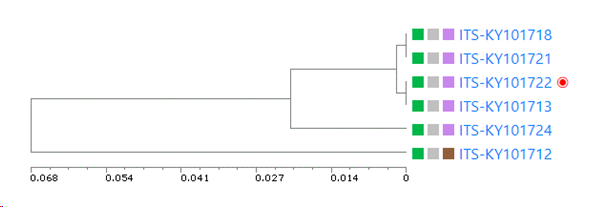
UPGMA tree of the selected records: if this checkbox is checked then there will be a specific section in the results that shows the tree. If unchecked then this section is not shown in the results.
|
|
|
Display fields used for comparisons: Check the checkbox to show the selected fields from the previous step (ITS sequences, Beta tubulin sequences and growth media here) in the first columns in the tree.
|
|
|
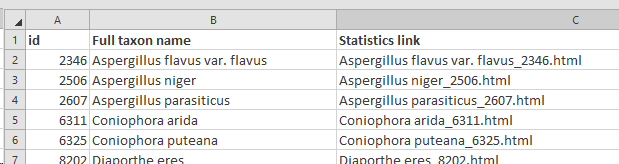
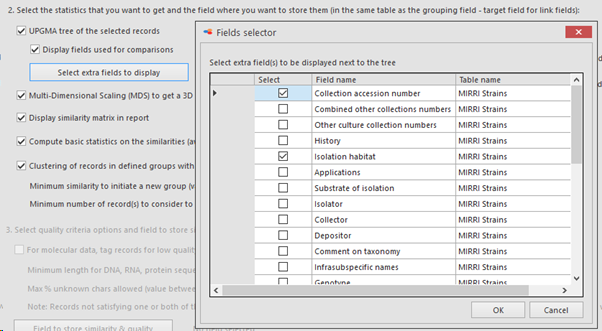
Select extra fields to display: When more field details should be included in the tree, here we added 1 extra field.
The selected field(s) will be shown between the first column (the selected field from point 5) and the last column (indicating the cluster the item is in). So if 1 extra field is selected, then 1 extra column is present (see picture below), when 3 extra fields are selected then 3 extra columns are in the between the first and the last column, 
|
|
|
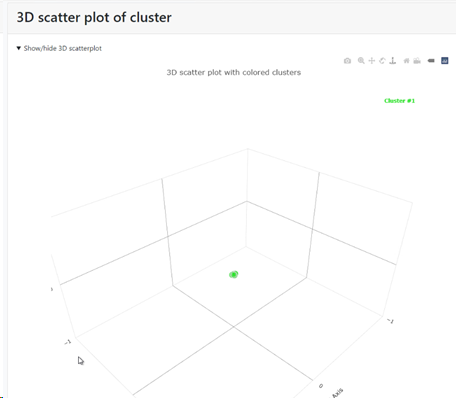
Multi-Dimensional Scaling (MDS) to get a 3D positioning of the records: if this checkbox is checked then there will be a specific section in the results that shows the MDS. If unchecked then this section is not shown in the results.
|
|
|
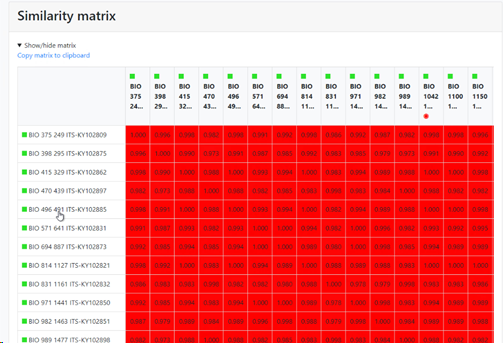
Display similarity matrix in report: if this checkbox is checked then there will be a specific section in the results that shows the similarity matrix between the items in the comparison. If unchecked then this section is not shown in the results.
|
|
|
Compute basic statistics on the similarities (average, min, max, medoid, etc): if this checkbox is checked then there will be a specific section in the results that shows the basic statistics (on top). If unchecked then this section is not shown in the results.
|
|
|
Clustering of records in defined groups with a certain level of similarity (DBSCAN):
When this checkbox the next 2 options (#10 and #11) are enabled.
|
|
|
Only activated when #9 is checked.
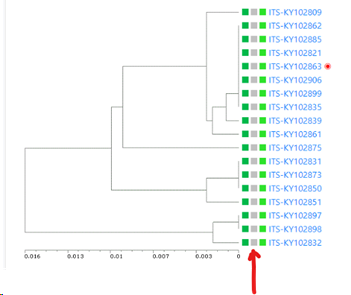
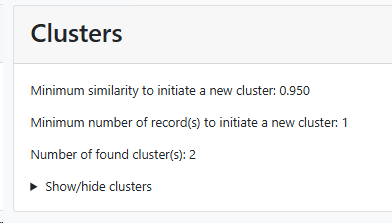
Minimum similarity to initiate a new group (value between 0 and 1; default 0.95): When the default of 0.95 is kept then it means that when a sequence is more than 5% different from the others (any other) then it will be placed in a separate cluster.
Here for example the similarity of the last sequence is 0.068 (6.8%), which is more than the 5% that was the limit, therefore it is placed in a separate cluster.
|
|
|
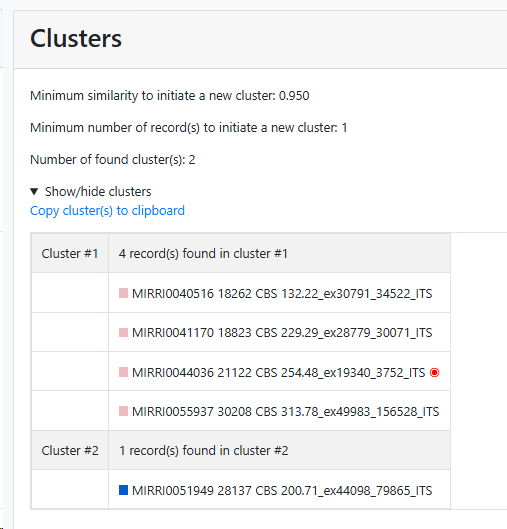
Minimum number of record(s) to consider to start a group (value above 0, default 1): Enter the number of records that should be at least in a group before it can be called a group.
|
|
|
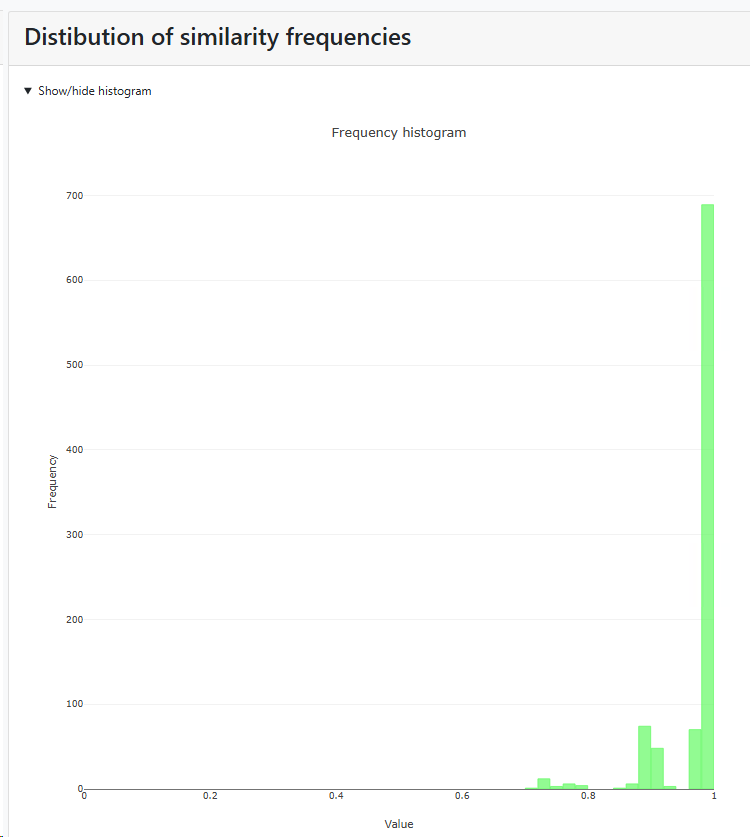
Histogram of similarity distributions: if this checkbox is checked then there will be a specific section in the results that shows the distribution of similarity frequencies. If unchecked then this section is not shown in the results.
|
|
|
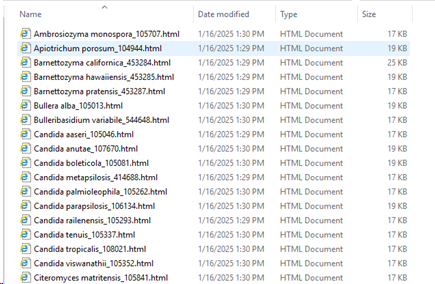
Path to store results: the results will be stored in separate HTML docs. One doc per species (in this case). Select the place where to store these documents.
|
|
|
Field to store statistics: select a File-link field where the results will be stored. This field should be selected from the table where the ‘Field to group records’ is pointing to.
|
|
|
Remove previously stored data in the selected field: if the checkbox is checked then the new results will overwrite the previous results in the field.
|
|