The picture below shows the data in a multi-dimensional view.
To save the MDS image, click on the Save as icon  on the top-left of the window.
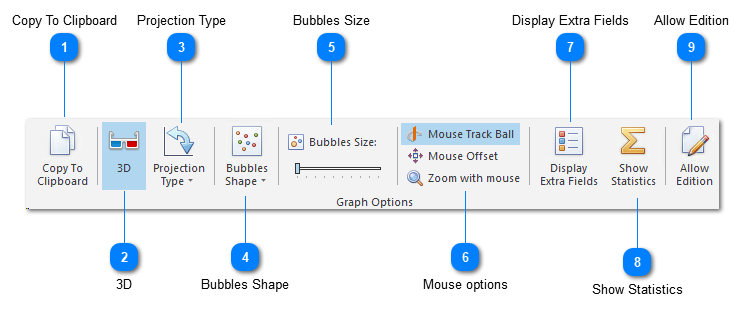
 Copy To ClipboardCopy the 3D image to clipboard.
|
|
 3DChange the view from 2D to 3D.
|
|
 Projection TypeThe way the data is presented, 2D, 3D,...
|
|
 Bubbles ShapeThe shape of the symbols representing the data.
|
|
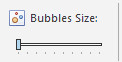
 Bubbles SizeThe size of the symbols representing the data.
|
|
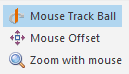
 Mouse optionsThree options for the usage of the mouse to improve the presentation of the data.
|
|
 Display Extra FieldsDisplay more fields in the lower grid to get more information. For more details click here.
|
|
 Show StatisticsShow statistics of the current multiple dimensional scaling. For more details, see MDS statistics.
|
|
 Allow EditionEdit the data in the fields that are displayed in the grid through the button 'Show extra fields'. The data will be actually changed in the database.
|
|