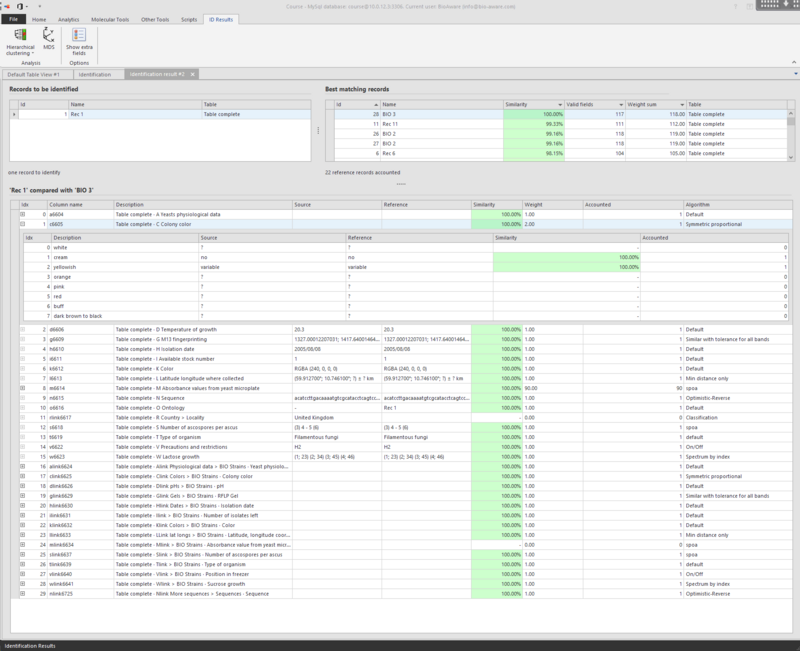
Identification results

Records to be identified (top-left grid): Unknown or 'source' records.
Best matching records (top-right grid): Reference records ordered by similarity.
'x' Compared with 'y' (lower grid): Results of the identification.
-
The background color of the cells in the lower grid indicates the similarity of the data in the two compared records in that field. Green is 100% similarity and Red is 0% similarity.
-
Note: Missing data and non-equivalent sets of data can be an issue. For example, if 5 criteria out of 15 are identical, the similarity is equal to 5/15 = 30%. The same coefficient will be obtained when 300 criteria out of 900 are identical. In the last case, more data are included and the set of characteristics employed is obviously larger and hence different. Consequently, identical similarity coefficients may cover different realities when incomplete data sets are being used.
-
When sequence fields are included in the identification analysis, double-click on a row containing DNA sequences in the results (lowe grid) to view the alignment of the pairwise comparison.
To start a new clustering based on the results of the identification:
-
Select the records to cluster from the Best matching records list (at least 3 records).
-
Click on the Hierarchical clustering or MDS.To add new fields to the lower grid, click on the button Show extra fields.

